Here are some of the sites our readers found to be helpful. If you find a site not listed that you think is really good, please let us know so we can check it out and add it to the listing below and we can share the knowledge. Thanks!
This page is a work in progress, under construction.
Datasets for Research and Data Analytics Practice
Free Database Access for Users
Federal Reserve Bank of St. Louis
https://www.stlouisfed.org/
FRED provides access to its extensive economic database, including cpi, gdp and real gdp, inflation, m2, pce, unemployment rate and other employment statistics, interest rates, and many other.
Kaggle
https://www.kaggle.com/
Inside Kaggle you’ll find all the code & data you need to do your data science work. Use over 50,000 public datasets and 400,000 public notebooks to conquer any analysis in no time. Kaggle offers a no-setup, customizable, Jupyter Notebooks environment. Access GPUs at no cost to you and a huge repository of community published data & code.
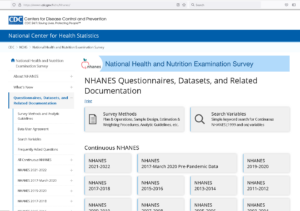
National Health and Nutrition Examination Survey
https://wwwn.cdc.gov/Nchs/Nhanes/n
The National Health and Nutrition Examination Survey (NHANES) is a program of studies designed to assess the health and nutritional status of adults and children in the United States. The survey is unique in that it combines interviews and physical examinations. NHANES is a major program of the National Center for Health Statistics (NCHS). NCHS is part of the Centers for Disease Control and Prevention (CDC) and has the responsibility for producing vital and health statistics for the Nation.
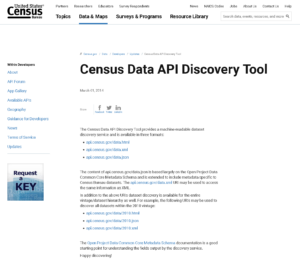
United State Census Bureau
https://wwwn.cdc.gov/Nchs/Nhanes/n
In alignment with the Digital Government Strategy, the Census Bureau offers the public wider access to key U.S. statistics. The Census application programming interface (API) lets developers create custom apps to reach new users and makes key demographic, socio-economic and housing statistics more accessible than ever before. The Census Bureau’s API allows developers to design web and mobile apps to explore or learn more about America’s changing population and economy.
The API lets developers customize Census Bureau statistics into web or mobile apps that provide users quick and easy access from an every increasing pool of publicly available datasets (see Data Sets for more information). More data sets will be added over time.
Customer Database Access
Quandl
https://demo.quandl.com/
Designed for professionals, Quandl delivers financial, economic and alternative data to over 400,000 people worldwide. Quandl offers essential financial and economic data alongside a suite of unique, alpha-generating alternative datasets. “With our unrivaled consumption experience, we have cemented a reputation for understanding and delivering what professional quantitative analysts need and want. Quandl’s customers include the world’s top hedge funds, asset managers and investment banks.”
Education
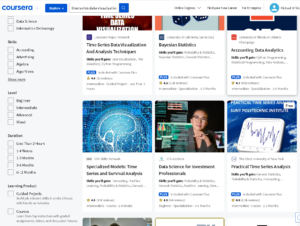
Coursera
https://www.coursera.org///
Coursera partners with more than 275 leading universities and companies to bring flexible, affordable, job-relevant online learning to individuals and organizations worldwide. Coursera offers a range of learning opportunities—from hands-on projects and courses to job-ready certificates and degree programs. Many excellent courses in statistics, programming, data visualization, mathematics, and other subject areas are available through the Coursera program.
Cal Poly Statistics Department Shiny App
https://statistics.calpoly.edu/shiny/
Collection of Statistics Apps that demonstrate concepts and use data visualization to show outputs. These apps are very well designed and informative. Check them out!
Reference: Doi, J., Potter, G., Wong, J., Alcaraz, I., and Chi, P. (2016) “Web Application Teaching Tools for Statistics Using R and Shiny.” Technology Innovations in Statistics Education 9(1). Available at http://escholarship.org/uc/item/00d4q8cp. Corresponding Author: Jimmy Doi
MACHINE LEARNING
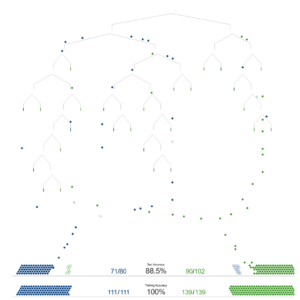
A visual introduction to machine learning
http://www.r2d3.us/visual-intro-to-machine-learning-part-1/
BY KUNG-YEE LIANG AND SCOTT L. ZEGER , Department of Biostatistics, Johns Hopkins University, Baltimore, Maryland 21205, U.S.A, October 1985. This paper proposes an extension of generalized linear models to the analysis of longitudinal data.
Probability and Statistics
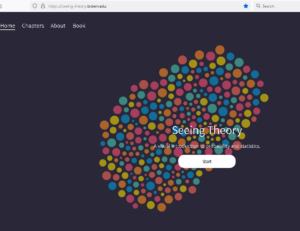
Seeing Theory
https://seeing-theory.brown.edu/
A visual introduction to probability and statistics. Seeing Theory was created by Daniel Kunin while an undergraduate at Brown University. The goal of this website is to make statistics more accessible through interactive visualizations (designed using Mike Bostock’s JavaScript library D3.js).
STATISTICAL MODELING
Marginal Models
Longitudinal data analysis using generalized linear models
https://www.biostat.jhsph.edu/~jleek/teaching/2011/754/reading/liangandzeger.pdf
In machine learning, computers apply statistical learning techniques to automatically identify patterns in data. These techniques can be used to make highly accurate predictions.
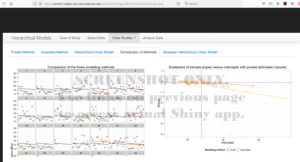
Multilevel Modeling
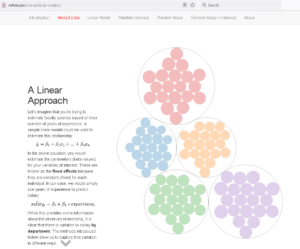
An Introduction to Hierarchical Modeling
http://mfviz.com/hierarchical-models/
This visual explanation introduces the statistical concept of Hierarchical Modeling, also known as Mixed Effects Modeling or by these other terms. This is an approach for modeling nested data. Learn how to translate an understanding of your data into a hierarchical model specification.
PLATFORMS AND TOOLS
ANACONDA

https://www.anaconda.com/
Anaconda offers the easiest way to perform Python/R data science and machine learning on a single machine. Start working with thousands of open-source packages and libraries today.
Data-Driven Documents
https://d3js.org/
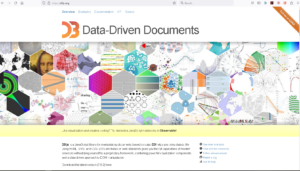
D3.js is a JavaScript library for manipulating documents based on data. D3 helps you bring data to life using HTML, SVG, and CSS. D3’s emphasis on web standards gives you the full capabilities of modern browsers without tying yourself to a proprietary framework, combining powerful visualization components and a data-driven approach to DOM manipulation.
JupyterLab: A Next_Generation Notebook Interface

https://jupyter.org/
JupyterLab is the latest web-based interactive development environment for notebooks, code, and data. Its flexible interface allows users to configure and arrange workflows in data science, scientific computing, computational journalism, and machine learning. A modular design invites extensions to expand and enrich functionality.
LaTeX – Document Preparation System

https://www.latex-project.org/
LaTeX is a high-quality typesetting system; it includes features designed for the production of technical and scientific documentation. LaTeX is the de facto standard for the communication and publication of scientific documents. LaTeX is available as free software. Among its other features, it is great for rendering formulas!
STATISTICAL APPROACHES
Bayesian Models Discussion
http://babieslearninglanguage.blogspot.com/2018/02/mixed-effects-models-is-it-time-to-go.html
Mixed effects models: Is it time to go Bayesian by default?
Tables and Calculators
Z-Score Table
https://z-table.net/
Z-Score Table
Student’s t-Distribution Calculator
http://statdistributions.com/t/
Student’s t-Distribution Calculator